
In [1]:
from nb2wp import nb2wp

help(nb2wp)
In [2]:
nb2wp('Readme.ipynb', out_dir='out/Readme',  remove_attrs=False,
      img_url_prefix='https://raw.githubusercontent.com/' +
                     'bennylp/nb2wp/master/out/Readme/img')

 is a definition of sigmoid.
In [3]:
import numpy as np
import pandas as pd
import matplotlib.pyplot as plt

df = pd.DataFrame({
        'name':['john','mary','peter','jeff','bill','lisa'],
        'age':[23,78,22,19,12,33],
        'state':['N/A','dc','california','texas','N/A','dc']
     })
print('Showing a dataframe:')
df
Out[3]:
In [4]:
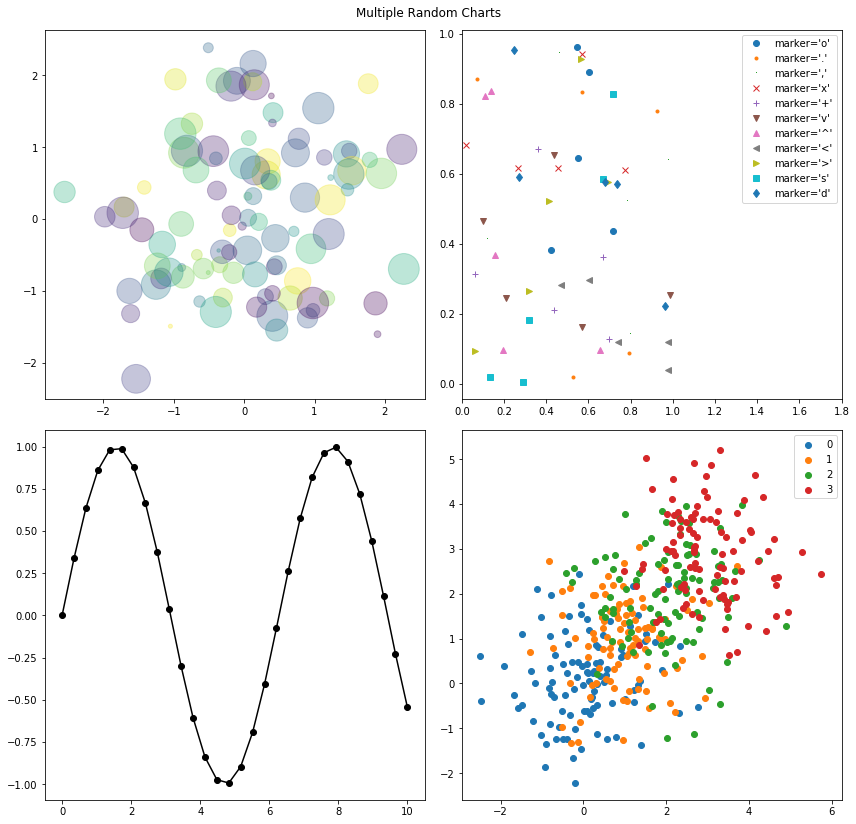
fig, ((ax1, ax2), (ax3, ax4)) = plt.subplots(2, 2, figsize=(12, 12))
fig.suptitle('Multiple Random Charts')
rng = np.random.RandomState(0)
x = rng.randn(100)
y = rng.randn(100)
colors = rng.rand(100)
sizes = 1000 * rng.rand(100)

ax1.scatter(x, y, c=colors, s=sizes, alpha=0.3,
            cmap='viridis')

rng = np.random.RandomState(0)
for marker in ['o', '.', ',', 'x', '+', 'v', '^', '<', '>', 's', 'd']:
    ax2.plot(rng.rand(5), rng.rand(5), marker,
             label="marker='{0}'".format(marker))
ax2.legend(numpoints=1)
ax2.set_xlim(0, 1.8);

x = np.linspace(0, 10, 30)
y = np.sin(x)
ax3.plot(x, y, '-ok');

for i in range(4):
    x = np.random.normal(loc=i, size=100)
    y = np.random.normal(loc=i, size=100)
    ax4.scatter(x, y, label=str(i))
ax4.legend()

fig.tight_layout(rect=[0, 0.03, 1, 0.97])
plt.show()
In [5]:
nb2wp('Readme.ipynb', out_dir='out/Readme',  remove_attrs=False,
      img_url_prefix='https://raw.githubusercontent.com/' +
                     'bennylp/nb2wp/master/out/Readme/img')
WordPress conversion from Readme.ipynb by nb2wp v0.3.1

Tinggalkan komentar